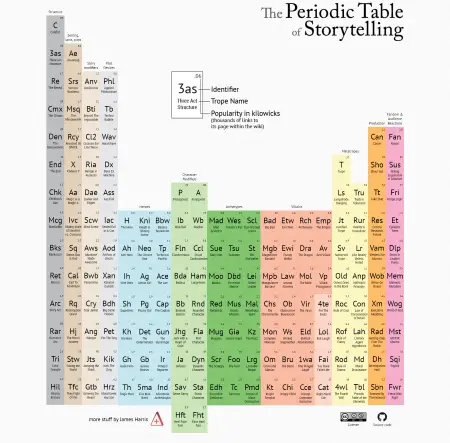
Infographics are everywhere. Anything you need to remember can be distilled into one diagram. Design Through Stroytelling’s Periodic Table of Storytelling is an easy-to-use chart that will jog your memory on every major story trope.
Thank artist James Harris for the resource, who followed the periodic table chemical elements as a guide. But instead of a tabular organizational chart of elements arranged in the order of atomic number, it’s organized into plot devices and archteypes.
Harris divided the infographic into columns covering:
- story structure
- setting, laws and plots
- story modifiers
- plot devices
- hero and villain archetypes
- character modifiers
- metatropes
- production
- fandom and audience reactions
The visual guide will help you use each trope effectively–and hopefully without cliche.

This compendium is easier to navigate than all those screenwriting books on your bookshelf. Just click on the element and you’ll be taken to the appropriate wiki page on TV Tropes for a detailed explanation.
Harris also includes “10 simple story molecules” created from the combination of various story elements.
You can use the Periodic Table of Storytelling free of charge here.